NGCUSD
U.S. natural gas futures started the week with an increase of over 5% due to cold weather forecasts. Cold weather conditions expected in the U.S. until mid-January are predicted to increase heating demand. While this situation causes a rise in prices, profit-taking had been observed in the past due to the absence of new narratives. Investors can evaluate market developments by monitoring the course of the European and U.S. stock exchanges throughout the day.
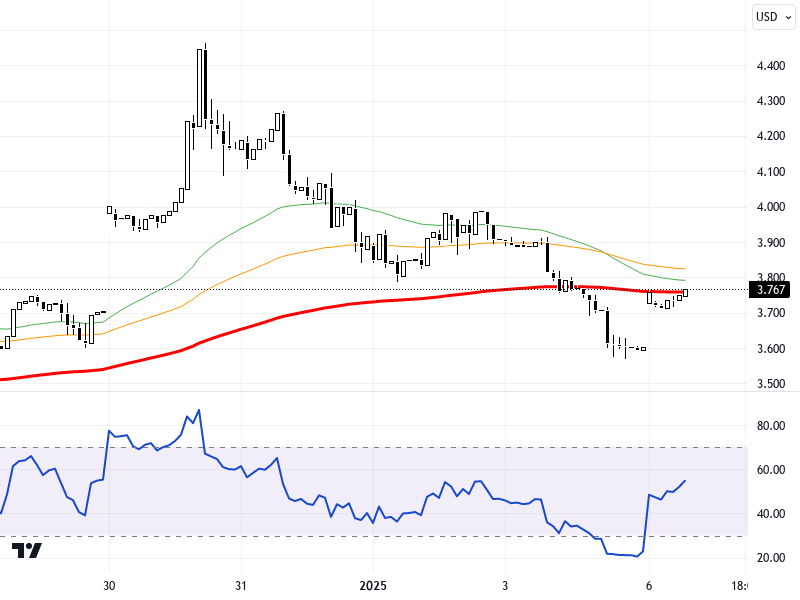
From a technical perspective, the NGCUSD pair is trading near the 3.57 resistance level on the daily chart. If this level is surpassed, the 3.62 and 3.67 resistance levels might come into play. In downward movements, the 3.47, 3.43, and 3.40 support levels can be monitored. The RSI indicator is at 61 and presents a positive outlook. It can be seen that the pair has risen by 4.55% on a daily basis. This data may indicate that prices could follow a positive trend in the short term.
Support :
Resistance :


