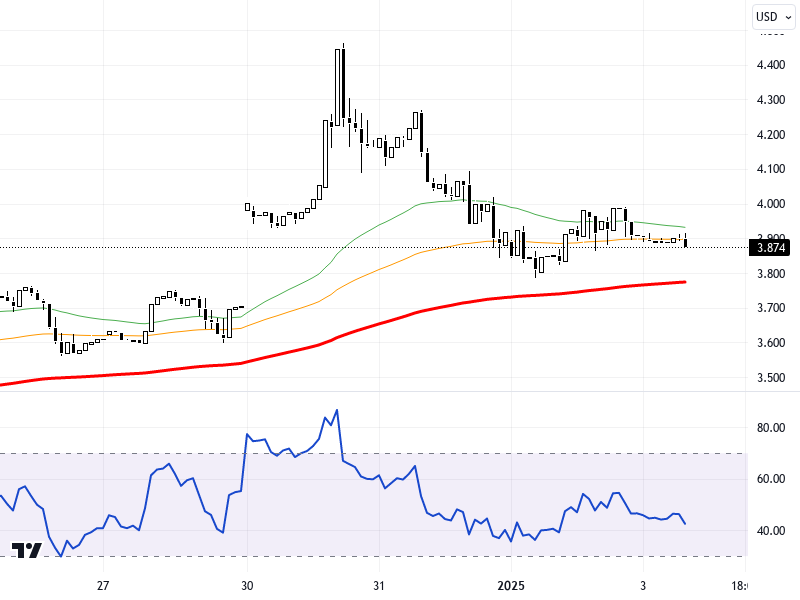
NGCUSD
U.S. natural gas futures continue to find support from expectations of a cold wave at the beginning of January and increased demand for natural gas exports. While profit-taking balances the market, investors are closely monitoring the trajectory of European and U.S. stock exchanges and the inventory data to be released by the U.S. Energy Information Administration. The strong rise observed in the global markets' dollar index and the current trajectory of U.S. 10-year bond yields could also affect natural gas pricing.
Technically, the NGCUSD pair is trying to hold above the support levels of 3.6 and 3.535 on the daily chart. In the continuation of the upward movement, the resistance levels of 3.74 and 3.8 are watched, while the level of 3.86 might emerge as a longer-term target. In the event of a possible downward pressure, support at the level of 3.47 could come into play below the level of 3.535. The RSI indicator is at 51, showing a neutral outlook, which suggests that the current equilibrium may be maintained. The price has decreased by 0.74% compared to the previous day.
Support :
Resistance :


