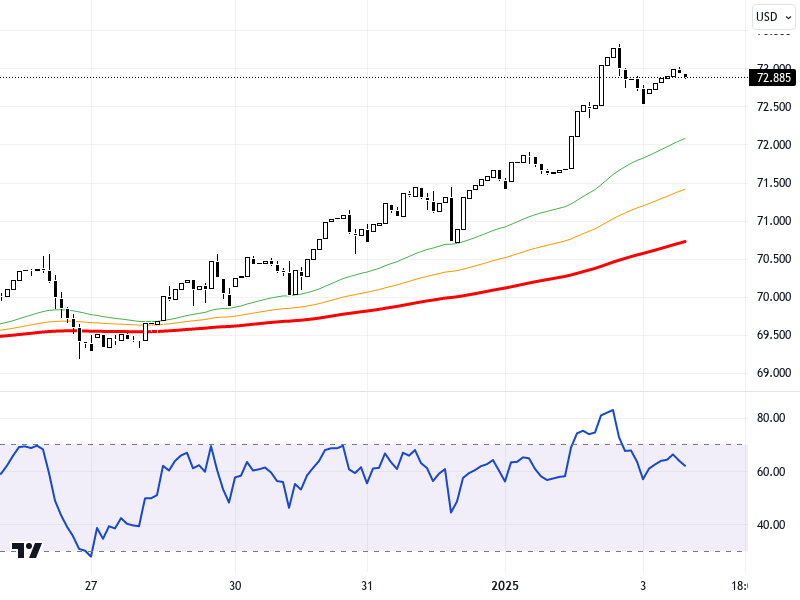
WTIUSD
Oil prices tested their highest levels since October 14 after finding support from commitments to promote growth in China and declines in U.S. inventories. However, there was a limited pullback as they couldn't remain at these levels. The mixed trend in global markets and economic data from the U.S. may influence short-term movements in oil. Monitoring the performance of European and U.S. stock markets as well as U.S. data flows might play a decisive role in oil prices. Additionally, the strengthening of the dollar index may exert pressure on oil prices.
Technically, WTI prices are moving between the 72.50 – 73.00 support levels on the hourly chart. In upward movements, resistance levels of 74.00 and 74.50 can be followed. If downward movements fall below the 72.50 support, levels of 72.25 and 72.00 may come into focus. The RSI indicator is at 53, showing a neutral market outlook. Prices have increased by 0.48% compared to the previous day. Maintaining the support levels may sustain the upward potential.
Support :
Resistance :


