NGCUSD
U.S. natural gas futures continue their selling streak after the New Year holiday. Expectations of warmer weather conditions in the Southeast and West regions of the U.S. from January 10th to 14th appear to have influenced the downward movement in prices. During this period, the course of European and U.S. stock exchanges will be closely watched by market participants. Additionally, while U.S. index futures are expected to start the day with limited gains, economic data such as manufacturing activity and unemployment claims in the U.S. may also affect the market.
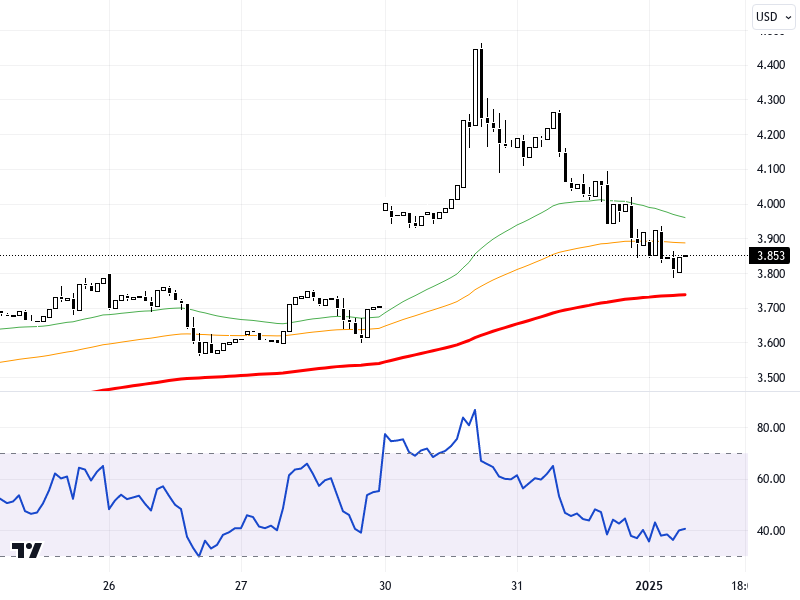
From a technical perspective, for the NGCUSD pair, the 3.535 and 3.47 levels can be observed as support, while resistance levels are highlighted at 3.65 and 3.74. On the chart, the pair is currently trading at the 3.853 level, showing a 1.63% decrease compared to the previous day. The RSI indicator is displaying a negative trend, indicating a weakening market outlook. In this situation, it may be crucial to maintain the support level of 3.535 for upward movements to occur. If these support levels are breached, declines towards the 3.43 level may come into play.
Support :
Resistance :


