NGCUSD
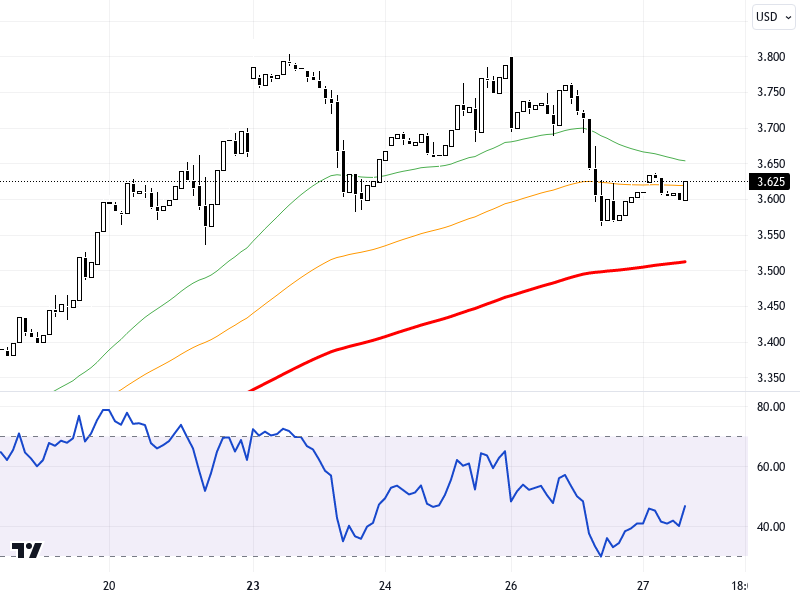
US natural gas futures are trying to find balance in the Asian session following yesterday's decline due to weak trading volume and mixed weather forecasts. Trends in European and US stock exchanges, along with inventory figures to be announced by the US Energy Information Administration, are among the key factors that could influence the pair. While a positive outlook dominates overseas markets, especially in Asian indices, US indices are moving in a flat trend. This could create uncertainties in the natural gas market as well.
Technically, the NGCUSD pair is being tracked on a 4-hour timeframe chart. Levels of 3.26 and 3.215 stand out as support, while short-term resistance is monitored at levels of 3.33 and 3.36. The RSI indicator is at 45, exhibiting a neutral outlook. This indicates a volatile trend in the pair. An increase of 0.42% compared to the previous day is observed; however, as long as the pricing remains below the 3.330 – 3.360 resistance zone, downward pressure may continue.
Support :
Resistance :


